Risk the audit committee can read, trend, and act on.
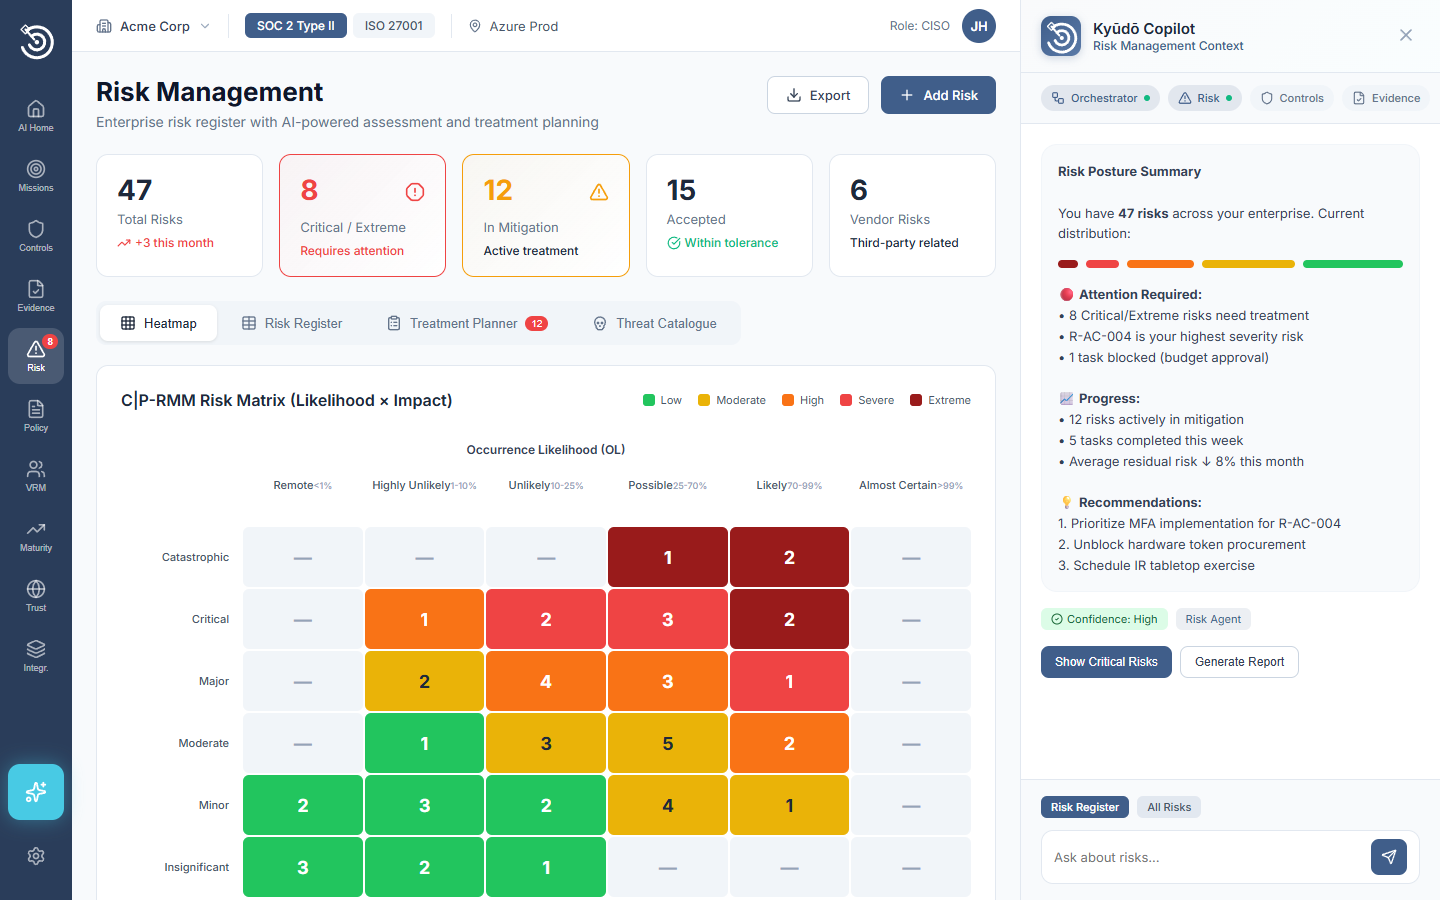
The audit committee's frustration with risk reporting isn't the data. It's the format. A spreadsheet snapshot tells them where risk was, not where it's going. Kyūdō's Risk Management Platform gives the board a continuously scored register with trajectory charts showing whether each risk is improving, stable, or accelerating. Vendor concentration, control drift, and regulatory exposure are tracked as live positions the audit committee can interrogate.
Built for how compliance actually works.
Risk trajectory, not last quarter's snapshot
Risk scores update automatically as control health and threat data change. The board sees direction of travel, not a frozen point-in-time position.
Vendor concentration off spreadsheets, onto a live register
Vendor risk moves off spreadsheets onto a continuously scored register segmented by business unit or regulatory boundary.
Control drift caught before it becomes a board conversation
Drift is detected and flagged automatically when risk velocity crosses a defined threshold. Remediation workflows launch immediately.
Board-ready dashboards exported on demand
Risk dashboards formatted for audit committee presentation, with trend lines that read quarter over quarter. Exported on demand, always current.
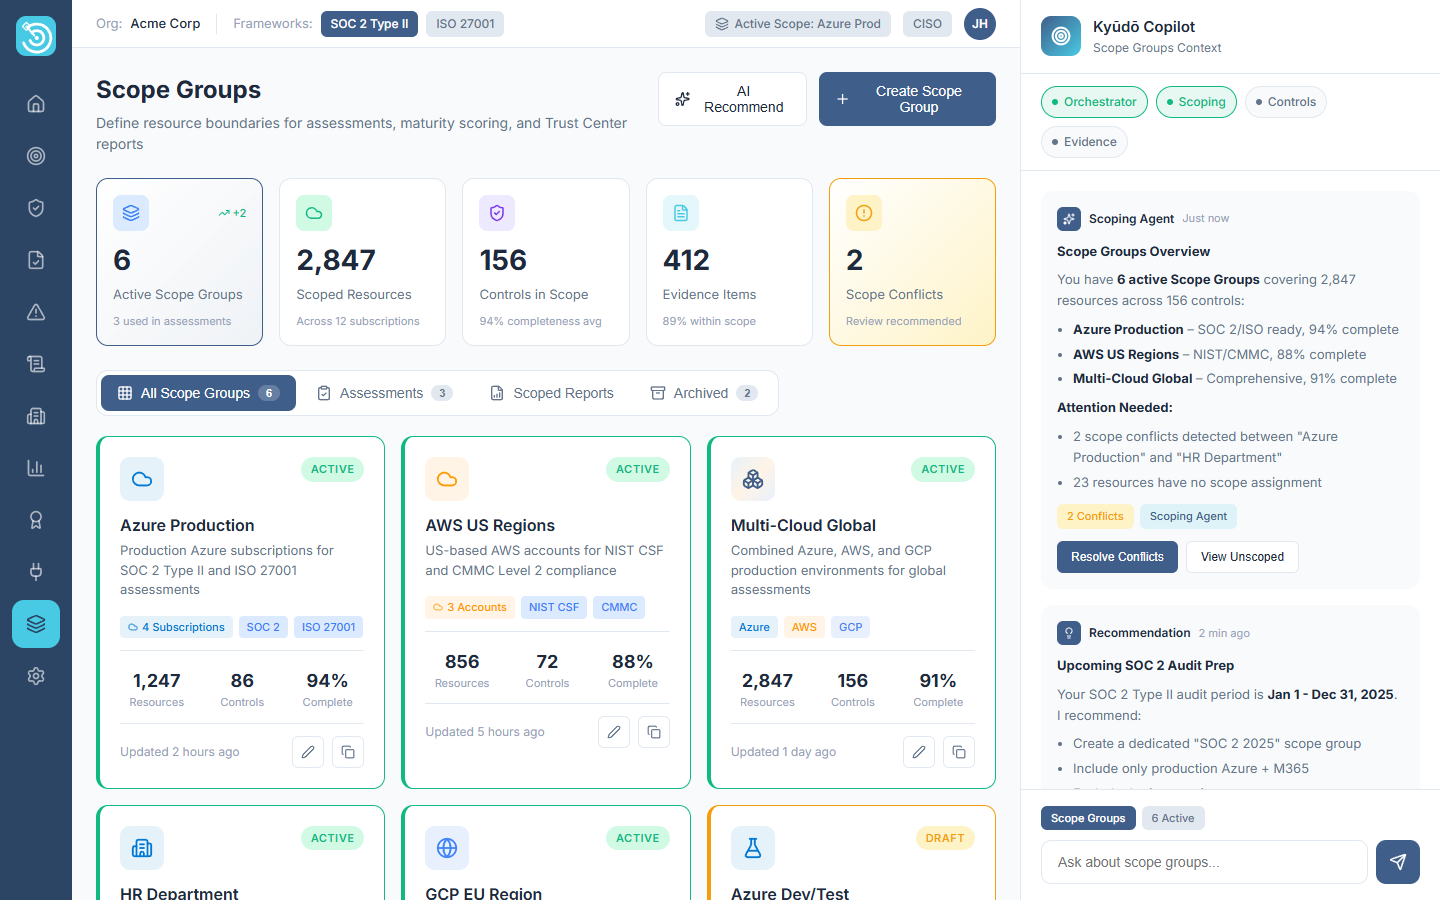
Risk Boundaries by Business Unit, Subscription, or Regulatory Perimeter
Scope groups let you partition your risk registry by organizational boundary: a business unit, an Azure subscription, or a regulatory perimeter. Each scope group maintains its own risk scoring, control linkage, and remediation queue. Executive dashboards roll up across all groups without losing the detail underneath. The audit committee sees what they need. Your GRC team sees everything.